Protecting and maintaining structural diversity is of global concern. This can be addressed, to some extent on a local level. Managing for structural diversity for forest ecosystems consists of three distinct and complimentary approaches:
Coarse
Filter Structural Diversity
Different species
have different habitat requirements. Some require late successional
forest structures while others require open or dense forest structures.
Thus, if an insufficient amount of one or more forest structures
exist on a landscape some species may not be able to live on that
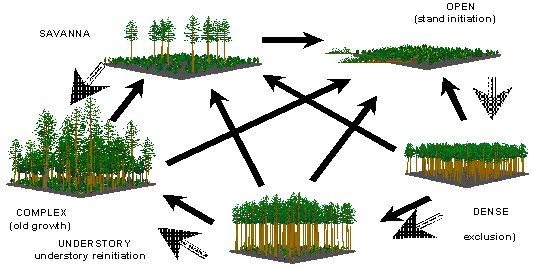
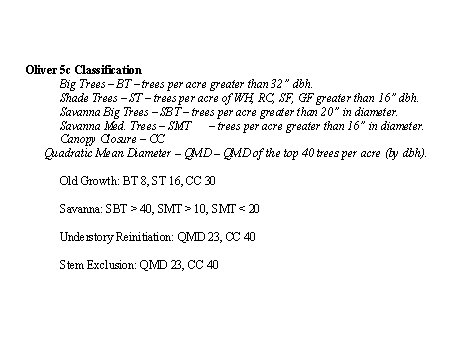
landscape. One forest structure classification system is the Oliver
5c. This consists of five stand structures that can be used for
surrogates for habitat types. These are shown below:
Using LMS each stand can be classified into one of these structures for each cycles of the management plan based on the following criteria:
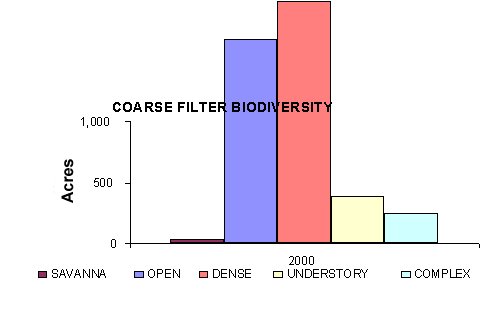
Measurable Criteria: Sufficient amounts of each structure in each management cycle as follows:
For example, during one time period, the targets for open, savanna, and complex structures are not met while dense and understory structures are.
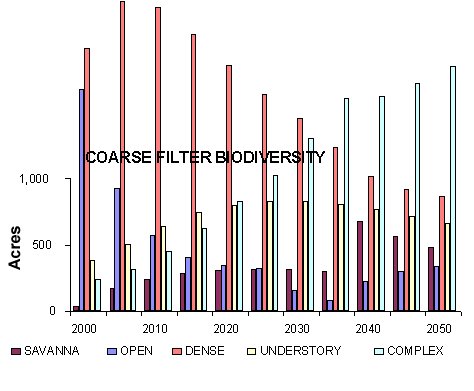
The objective is to maintain structural diversity over time; therefore, the measurable criteria are the number of management cycles that the target amounts for each structure are met. In the example below, the savanna target was met 9 out of 11 cycles. All structures were met in 47 out of 55 cases.
Summary Value
The summary value will be defined
as the percentage of the total number structural goals that a
structural goal is reached. In this example there are 11 management
cycles and 5 structures. Thus, there are 55 structural goals for
the life of the management plan.
An example from the above chart is:
Normalized Values
Normalized values convert the summary
vales to a scale of 0 - 10. An example of this is:
Caution: Because the algorithm uses a cutoff values (5% or 10%)to determine whether a landscape is considered to have a particular structural type, it it possible to have extremely divergent values when the relative percent of each structural type is almost identical. For example, if Landscape A had 4.5%, 4.5%, 9.5%, 9.5%, and 72% of each of the structures, respectively, over all years the summary value would be a 2; whereas if the same Landscape A had 5%, 5%, 10%, 10%, and 70% of each structure, respectively, the summary value would be 10. It is important to know what the threshold value is and the check the output in light of these issues.
Fine
Filter Structural Diversity
Critical habitats for several species
which have been listed as threatened or endangered are late successional
or "old growth" habitats. Riparian habitats are also
of interest since they help to protect water quality and habitat
fish and other aquatic creatures.
Riparian areas will be delineated and not be actively managed in the initial management plan. For future updates of the management plan the possibility of active riparian zone management, in accordance with state practice rules, will be examined.
To measure "old growth" habitat the complex structure of Oliver 5c will be used. To measure late successional habitat both understory and complex structures will be used.
Measurable Criteria: Sufficient amounts of late successional and complex structures as follows:
As an example of this, during one time period, the targets for late successional and complex structures are shown with the solid line. Note that the objective (minimum amount of structure) was not met for the complex, but was met for the late successional.
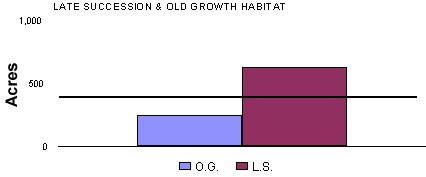
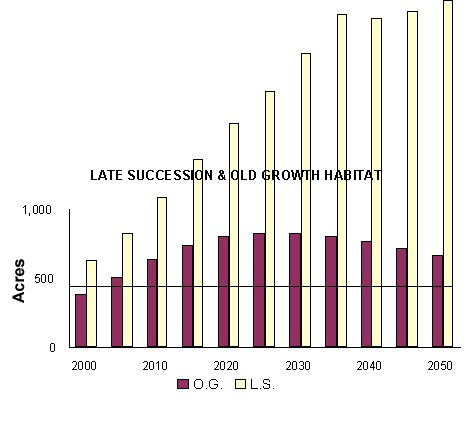
The objective is to maintain these structures over the life of the management plan; therefore, the measurable criteria are the number of 5-year management cycles that the target amounts of each structure are met. In the example below, the complex structure was met in 10 out of 11 cases, and the late successional structure was met 21 out of 22 cases.
Summary Values
The summary vales will be defined
as the percentage of the total number of structural goals that
are met for each late-successional and complex structures.
For the example above the summary values would be:
Normalized Values
Normalized values convert the summary
values to a 0 - 10 scale. An example of this, for the above example
is:
Maintaining
Reserve Areas
Reserve areas are typically addressed
at a regional scale. In the western Washington region large "reserves"
already exist in Mt. Rainier and Olympic National Parks; therefore,
this issue may not be considered important for Satsop Forest.
There are two types of reserves that could be considered for Satsop
Forest:
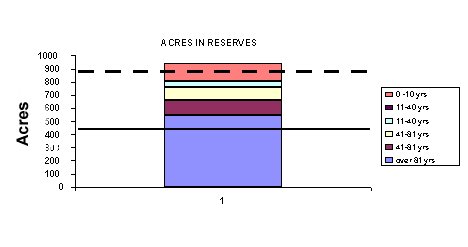
Measurable Criteria: Sufficient amounts of reserve areas as follows:
As an example, in the following chart, the target for old forest reserves is met because the acreage in forests over 81 years old exceeds the solid line. The target for all reserves is met because all reserves exceed the dashed line:
Summary Values
The summary values will be defined
as the percentage of the forest area which meet the criteria for
reserve areas over the life of the plan
Normalized Values
Normalized values will convert the
summary values to a scale of 0 - 10 as follows:
Updated 20/12/2000 by Kevin "thujaman" Ceder