Landscape Management System (LMS)
Example Landscapes:
Bent Creek |
Bremerton |
Mid Forest Lodge |
San Carlos Apache |
Landscape Management System - Examples
Examples of using LMS are shows below along with several case studies where LMS was used to implement a managment plan for a landscape.
Example Landscapes
The following case studies demonstrate the application of the Landscape Management System. The case studies are divided into two groups: forest values and landscapes. Forest values case studies highlight LMS analyses for a specific forest resource, such as biodiversity, productivity, forest heath. Landscape case studies are analyses that use the landscape management approach to provide the full range of forest values for a particular landscape through time.
Bent Creek |
Indian Island - DoD, NDCEE |
Pack Forest, WA |
Bremerton |
San Carlos Apache, AZ |
|
Mid Forest Lodge, MI |
Satsop, WA |
|
Northeastern China - Amur Tiger Habitat |
|
LMS Introduction
The Landscape Management System (LMS) is an evolving set of software tools being designed to aid in landscape level management. LMS is being developed as part of the Landscape Management Project at the Silviculture Laboratory, College of Forest Resources, University of Washington. Landscape Management System (LMS) is a computerized system that integrates landscape-level spatial information, stand-level inventory data, and distance-independent individual tree growth models to project changes through time across forested landscapes. LMS facilitates forest management, planning, policy-making, as well as education. LMS coordinates the execution and information flow between 20-plus programs. These programs: format, classify, summarize, and export information; project tree growth and snag decay; manipulate stand inventories; and present stand- and landscape-level visualization and graphics. Stand Projection Stand projection in LMS is accomplished by the use of external growth models. The growth models currently used are FVS (all variants) and ORGANON (SWO, WWV, SMC variants in the ORGANON-DLL). Additional growth models can be linked into the system by developing interface programs to transfer information to and from the growth model. Tabular and Graphical Outputs Projected inventory information can be presented to the user via various tables and charts. The tables can be viewed in a text editor, spreadsheet, or save to a file for subsequent analysis. |
|
 |
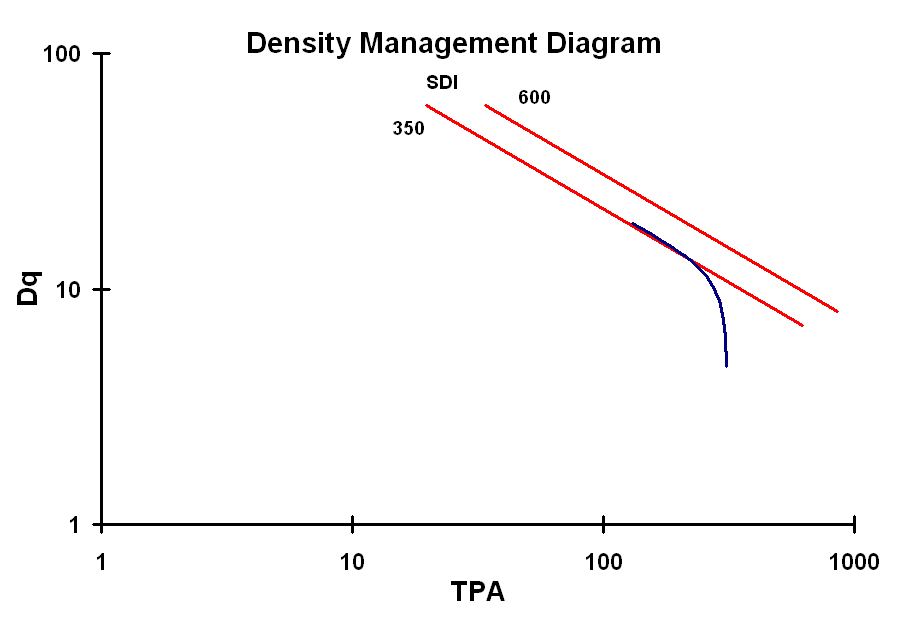 |
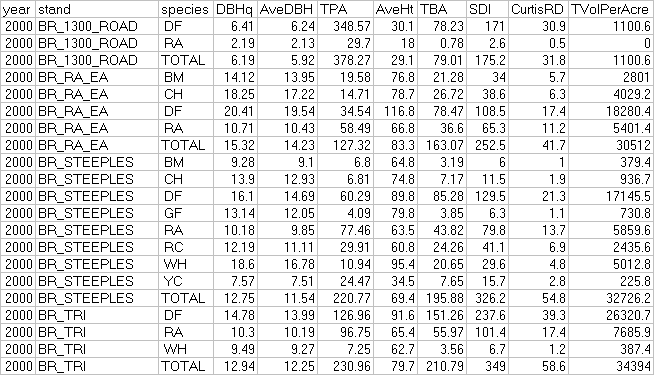
| Example summary table displayed in Excel. The summary table contains typical stand level summary statistics for each stand by species. Click on the table above to view a larger image. | Tabular outputs from LMS can easily be converted to charts with Excel. The example above creates is a density management diagram for Douglas-fir created from the summary table. Click on the image above for a larger image. |
 |
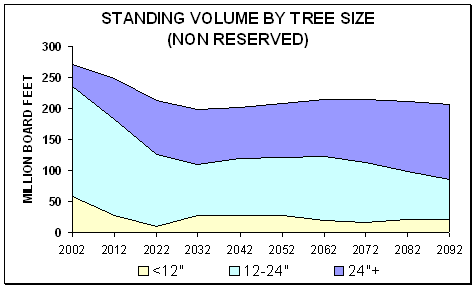 |
| The above chart displays the changing proportion of structural stage (Oliver 5c) for the landscape through time. This chart was extracted from the Toggle companion spreadsheet. Click on the image to view a larger image. | The above chart shows the amount and proportion of standing volume by tree size over time. This chart was extracted from the Toggle companion spreadsheet. Click on the image for a larger image. |
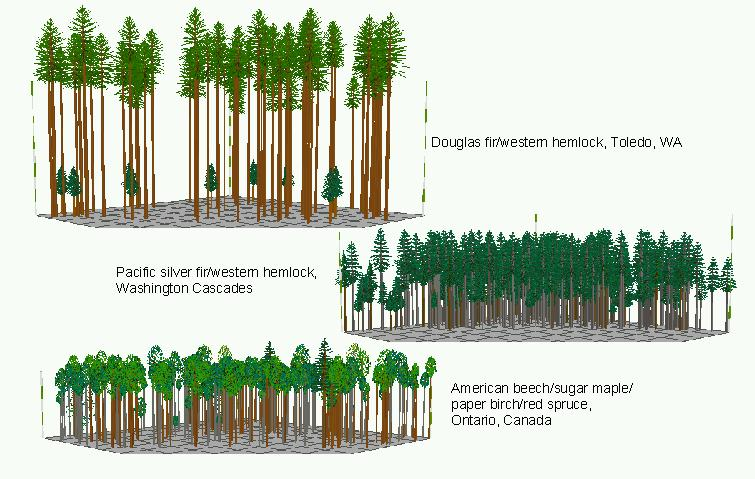
Stand Visualization Stand Visualization can be used to example inventory information is new ways. It can be useful for finding errors in data, communication between disciplines, or as an alternative way to view the information. LMS uses the Stand Visualization System (SVS) for it's stand level visualization. SVS is developed by Bob McGaughey of the Cooperative for Forest-System Engineering (FORSYS), Pacific Northwest Research Station, USDA Forest Service. Click the image below for more examples of Stand Visualization.
Treating Stands Stand treatments include thinning to target BA, Percent, SDI, and TPA; from Above, Below, or Proportional; with Species Selection (Include or Exclude), Diameter Limits, and the ability to add new tree records by planting or ingrowth. Landscape Visualization Landscape visualization in LMS is accomplished by using the EnVision -- Environmental Visualization System developed by Bob McGaughey of the Cooperative for Forest-Systems Engineering (FORSYS), Pacific Northwest Research Station, USDA Forest Service. |
|
 |
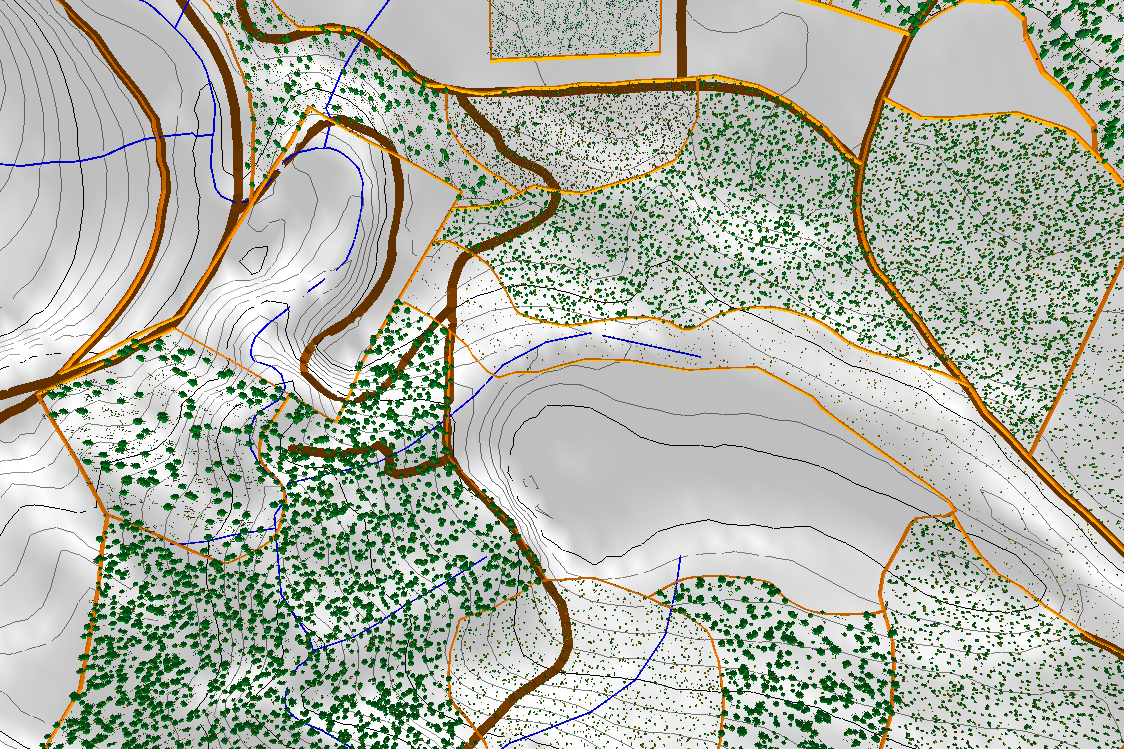 |
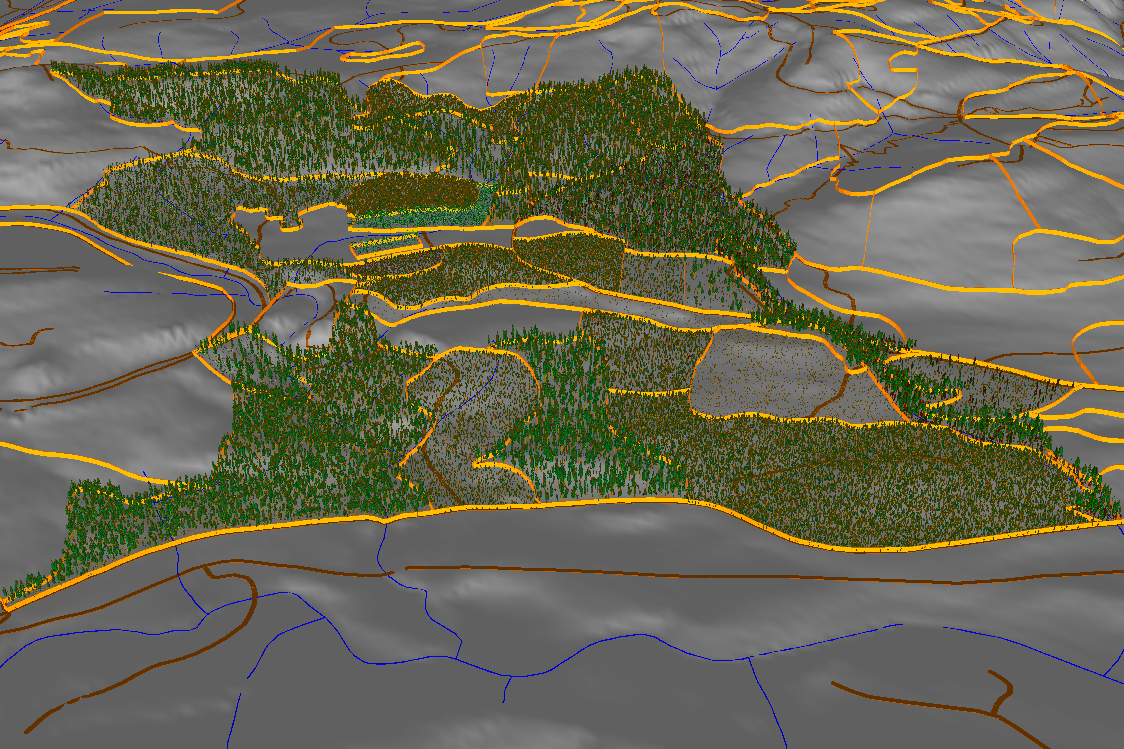
| Envision displays trees on the ground service by combining inventory information, elevation information, and a stand boundary map. In addition Envision can also display other spatial features using overlays to indicate the position of those features. The above example shows roads (brown), streams (blue), and stand boundaries (orange). Click on the image for a larger image. | Envision can display the ground surface from any location allowing for the customization of the visualization. The example above is an overhead display from about 6000 feet above the ground surface. Click on the image for a larger image. |
Additional Spatial Analysis When combined with GIS analysis software (Arc/Info or ArcView) LMS can be used for additional analysis by combining the information projected within LMS with the spatial location of stands. Any appropriate tables from LMS can be easily linked to ArcView projects to facilitate further spatial analysis. |
|
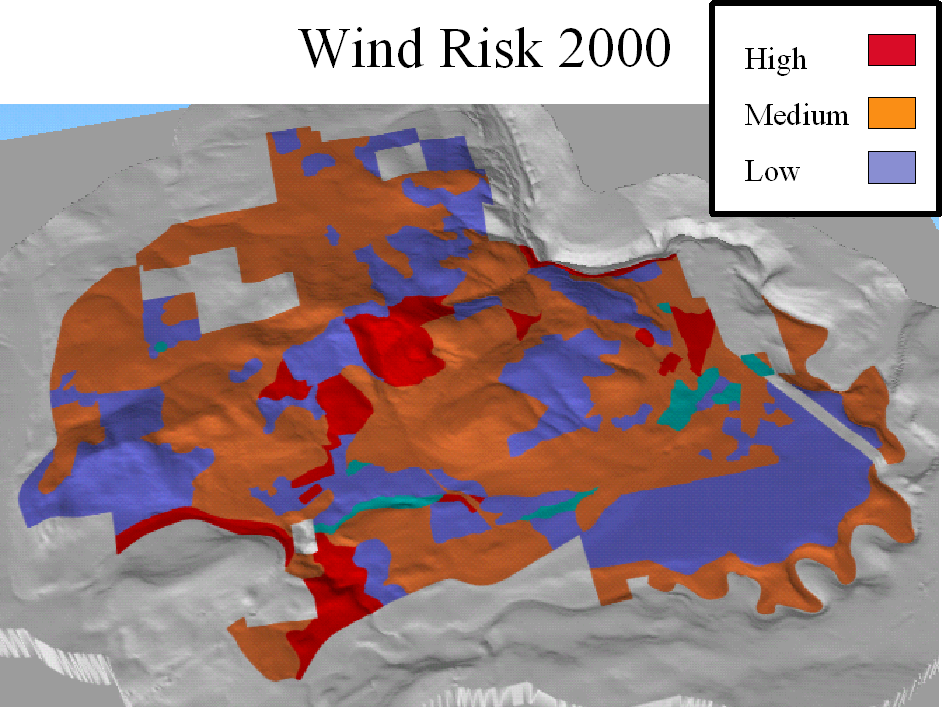 |
The image to the left combines the use of LMS, Envision and ArcView to create a map of wind risk potential on Pack Forest for a proposed management scenario. |
May 30, 2011 11:06 AM
University of Washington |
Yale School of Forestry & |